DataFest Competition
Background
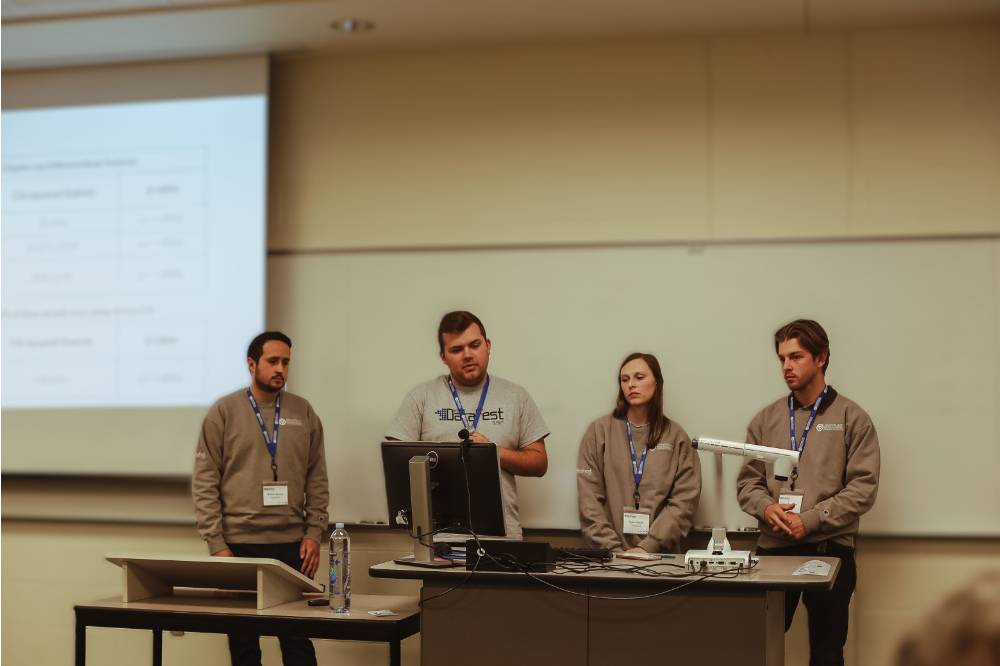
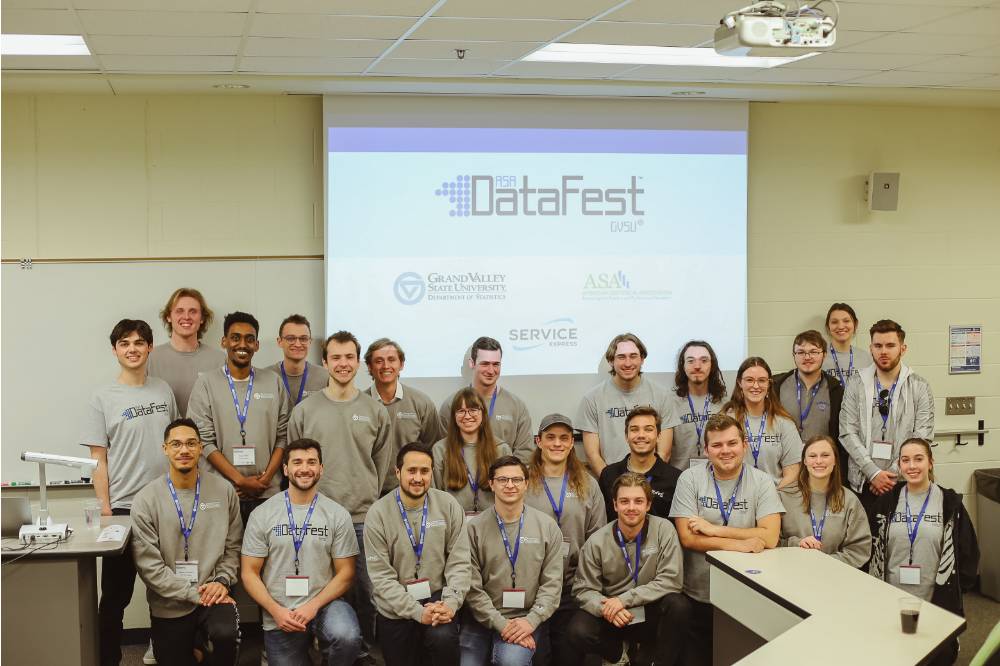
DataFest is a national data analysis competition that I competed in and is sponsored by the American Statistical Association. In this competition, students attempt to derive the best insights for the client. The client and provider of the data that year was CourseKata. They wanted us to analyze multiple datasets that they obtained from one of their college textbooks for statistics. The textbook contained multiple versions and different college levels. The datasets were released to us at 6pm on Friday, and we had to turn everything in by noon on Sunday. We then gave a short presentation to a panel of judges of our findings.


Conclusion
The data we focused on was the activity scores for each chapter and engagement of the students, measured by the time a student spent per page in minutes. Each chapter contained three separate activities. There was a pre-assessment, where the students assessed their readiness to begin each chapter, activities throughout the chapter assessing their levels of comprehension, and a post-assessment, asking the students how they felt about their comprehension of the chapter.
During our analysis, we found that there was a significant drop in engagement of the students in chapters five through ten, but no change in pre, mid, or end of chapter activity scores. In some cases, the average time spent per page by the students dropped by more than half. We concluded that the client make chapters five through ten more engaging and challenging, as the students seem ready to handle more complex content.
Awards
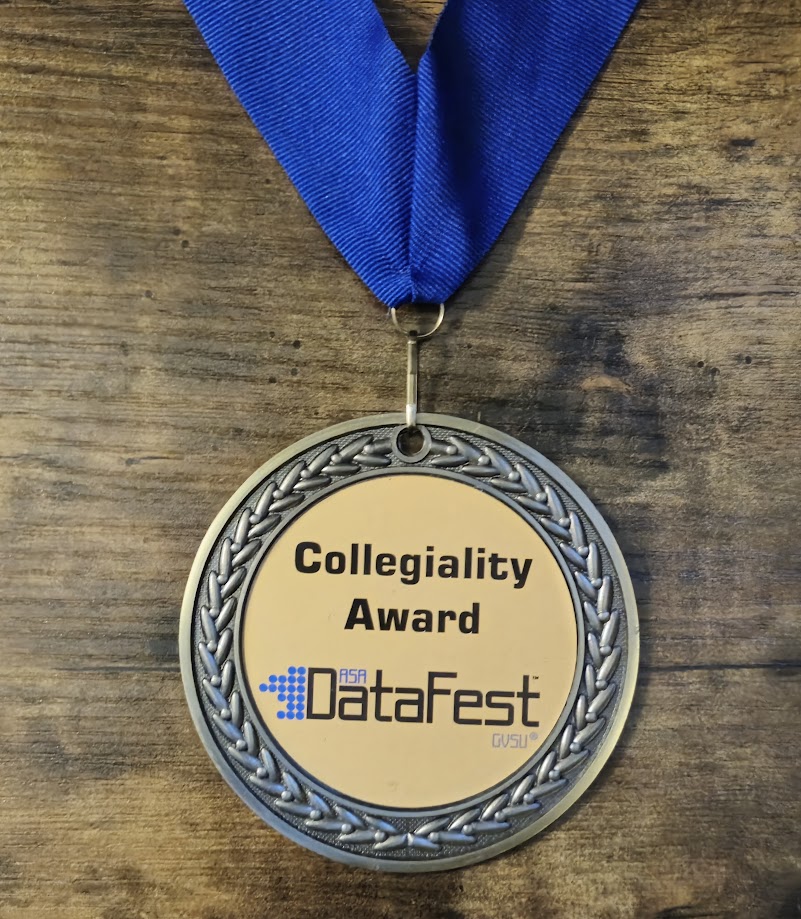
Among the Grand Valley State University participants, my group of four received two awards. We were honored with the Neal Rogness Collegiality Award for our exceptional teamwork and secured second place for the Best Visualizations Award, recognizing the visualizations I created.


